Debugging Azure Functions with Windbg
When all else fails troubleshooting a production issue I often reach for Windbg to dig into a problem. For troubleshooting issues like high CPU or memory usage, Windbg is a great tool to pinpoint the problem. Windbg allows you to open a memory dump of a running application and inspect it. Anywhere you can run .NET code should support taking a memory dump, which you can then inspect using Windbg. I recently had to troubleshoot an issue with a .net core Azure Function application and while the steps were a little different than a web application, it is possible. Note - this post assumes you have Windbg installed. If not follow the link above and install it. I recommend the version you can get through the Windows store.
Take memory dump of running function
First, open the KUDU site for your problematic azure function that is running in Azure. The URL will look like https://<your-function-name-here>.scm.azurewebsites.net. Navigate to the Process Explorer tab and copy the PID for the process running your function. This might look weird because the process is running W3WP.exe but that is expected. There should only be two options and one will be tagged with the scm tag, meaning that is the process running the scm site. Choose the W3WP.exe process not tagged scm and copy the PID.
Next, open the Debug Console tab. I usually choose the CMD option but either should work. Navigate to the logfiles directory and make a new directory to hold the dump files. I typically use dumpfiles as the name. Navigate into the new directory and run the following command to generate the dump file - D:\devtools\sysinternals\procdump -accepteula -ma <your-PID-here>. That will generate the dump file and place it in the current directory. Finally, download the file with the .dmp extension that was generated to your local machine.
Determine platform details and load into debugging session
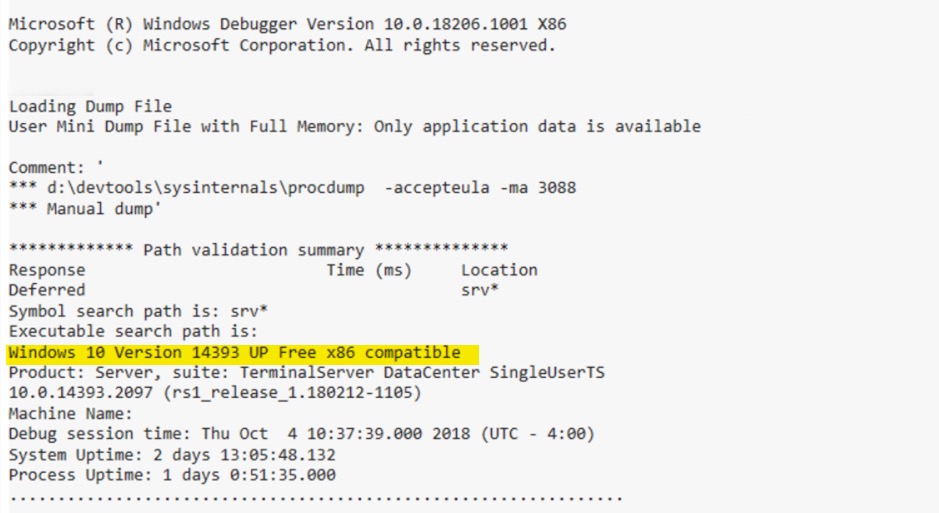
Open Windbg and load the .dmp into your debugging session. First, we have to determine if the application was running as x86 or x64 (this will be important later on). You should be able to find it in the output when the file was loaded. See the image below for an example (the example was running as x86).
Now we are ready to inspect the memory dump. The next step is to load the appropriate SOS.dll (debug extensions for .net) for the .net runtime your application is running under. The easiest way to ensure you have the right version is to download it from the KUDU site. To find where it’s located run the following command in Windbg - .loadby sos clr for full framework applications or .loadby sos coreclr for .net core applications. That command attempts to load the sos.dll from the same location that clr.dll/coreclr.dll was located on the machine running the application. Since we aren’t on the KUDU site the command fails but it will output the path to the dll in the error as shown below.

Take the path from the error message and navigate to that location in the KUDU site for your application. Note that you have to press the System Drive button in the Debug Console to navigate to the root of the D:\ drive. Then you can move to the path specified in the error message. In my case it was D:\Program Files (x86)\dotnet\shared\Microsoft.NETCore.App\2.1.4. Once you are there, find the SOS.dll in that directory and download it. Finally, load that dll via the .load command - .load C:\the\downloaded\file\path\SOS.dll.
Inspect the memory dump
At this point we have a memory dump of the application and the debug extension for .net is loaded. Providing concrete next steps is tough because it depends on your problem. A good place to start is by running !sos.threadpool to output statistics about the threads in the application and the CPU percentage. !sos.threads will show the details of each thread in the application.
Another useful debug extension to consider using is MEX. Go to the MEX page and download the appropriate dll for your application. This is where the x86/x64 inspection we did earlier is useful. Once you have the right version downloaded, load it via .load C:\path\to\MEX.dll. You can see all the .net related commands by running !mex.help -cat 'DotNet' but I often find !mex.sqlcn useful for looking at open sql connections and !mex.us is helpful to automatically look at all stack traces of running threads and group similar stacks together.
Other resources
Windbg commands are cryptic and difficult to remember so I have the best luck googling for my problem with “windbg” in the query to find blog posts that talk about how to debug my problem. Some especially useful articles I find myself going back to again and again are below. Good luck!
Other useful Windbg posts
- https://theartofdev.com/windbg-cheat-sheet/
- https://blogs.msdn.microsoft.com/tess/2006/10/16/net-hang-debugging-walkthrough/
- https://blogs.msdn.microsoft.com/waws/2015/07/01/debugging-a-w3wp-memory-dump-of-a-slow-performing-asp-net-azure-web-app/
- https://blogs.msdn.microsoft.com/jankrivanek/2012/11/15/setting-up-managed-code-debugging-with-sos-and-sosex/